B2B SaaS Funnel Conversion Benchmarks (and how to use them)
Nobody loves direct competition. When another company offers the same services, you have to fight tooth and nail to stand out to your customers.
That said, competition isn’t all bad. In fact, our competitors can also be a critical point of insight we can use to develop our business strategy. By using B2B SaaS funnel conversion benchmarks for our sector, we can see how we stack up against our competitors.
From there, we can develop a plan to improve the areas we’ve fallen behind in and enhance our strong points. With how accessible this data is, it can quickly transform into a map toward our success.
In this article, we’ll dive into everything your business needs to know about B2B SaaS funnel conversion benchmarks, including what they are, how to use them, and the core terms you’ll come across.
Key terms to know
Before we get started, let’s quickly define some key terms that will come up when dealing with funnel conversion benchmarks.
- Website visitor – Any individual who lands on your website. A visitor doesn’t need to engage with anything to fall into this category.
- Lead – A lead is someone who has engaged with your website to gain more information. Typically, this includes leaving their email address, name, and/or number.
- Marketing Qualified Lead (MQL) – An MQL is someone that your company identifies as fitting the criteria of a typical customer. The criteria that you use could be demographic or psychographic.
- Sales Qualified Lead (SQL) – An SQL is someone who’s ready to be contacted by your sales team. A person progresses to this stage when there is a high potential for them to convert into a paying customer.
- Opportunity – An opportunity is a potential customer that has shown they are intent on purchasing.
- Closed – An individual is “Closed” once you have successfully sold your products or services to them. They have converted into a paying customer.
What are conversion benchmarks, and how are they useful?
Conversion benchmarks are data-backed studies showing the average conversion rates for different industries.
Thanks to a continual flow of information in and out of businesses, most industry data is now widely available. We can search for data specific to B2B SaaS and quickly find typical rates across each conversion stage for different business niches.
Let’s take a look at the graph below.

We can see that both Project Management and Telecommunication have the highest MQL (Marketing Qualified Lead) rate. Yet, entertainment has the highest close rate, at 43%.
Okay, that’s great and all, but why is this important?
Shouldn’t I focus on my own business instead of comparing it to others?
Absolutely!
Buuuut also not quite.
While your own business should always be your priority, industry benchmarks can help you learn where exactly you should invest your effort.
Funnel conversion benchmarks show how you stack up against the competition. If you’re routinely displaying worse conversion rates than similar businesses in your industry, then you’ve found a clear sign that you need to adjust your strategy.
Using industry benchmarks will point you toward critical areas where you can improve or refine your business strategy.
How to find the right benchmarks for you
There’s no such thing as a universal good conversion rate. Why? Because the context of business varies so enormously across different industries, company sizes, and even marketing channels. What might be fantastic for an NGO might be a drop in the bucket for a B2B SaaS brand.
These variations across different industries are why finding your exact niche is so important. Exploring data from companies much larger or smaller than you won’t give you much useful insight. Just like how company information in a different sector won’t help your company strategise.
Across the board, the SaaS conversion rate sits around 22%. But that won’t help us if we’re in a more specific niche of SaaS, like medtech, legaltech, fintech, or client services. When finding benchmarks, always consider where the data comes from. Look for companies:
- In your business sector.
- Of a similar size.
- That publish data from the marketing channel you are exploring.
The closer you can get to data that reflects your own company, the more valuable a benchmark will be to you.
Benchmarking funnel stages
Another useful way that you can get even more from your benchmarking is by focusing on data from different stages of the B2B SaaS marketing funnel.
Metrics from the bottom of the funnel will look very different from those at the top, and vice versa.
Your business can extract value by benchmarking each stage separately. Start at the top of your funnel, benchmarking total visitors compared to your competitors to get insight into your brand awareness. From there, you can work down the funnel and see how you stack up against the competition on a whole range of metrics.
Examples of SaaS funnel conversion benchmarks
One of the most important differentiating factors that we encounter in B2B SaaS is company size. In this industry, we’re competing against everyone, from tiny online software platforms to enterprise giants.
Take a look at these figures.

As you can see, conversion rate benchmarks vary greatly between different company sizes. While smaller businesses reach a 46% closed rate, only 31% of $1b+ firms do the same. Understanding where your company falls in this range will help orientate you.
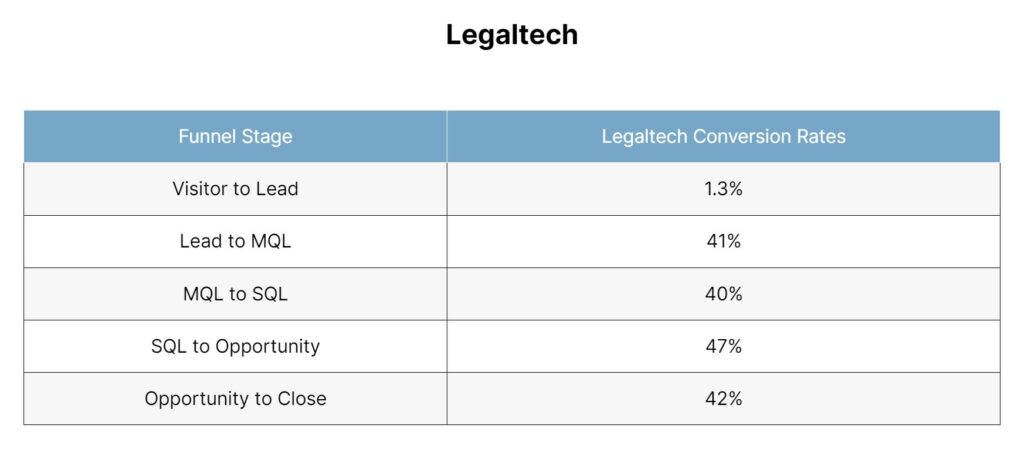
Another factor to consider is the specific area of B2B SaaS technology that you’re working in. Let’s look at data from two industries: Medtech and Legaltech.

The med tech industry boasts high visitor-to-lead conversion rates. Yet, it offers a lower closed customer close rate.
Opposingly, legal tech has a lower visitor-to-lead conversion rate but manages to take a higher percentage of those leads all the way through to closure.
When using conversion benchmarking, it’s vital that you use data from your industry. While we all fall under the tech umbrella, there is a lot of nuance to consider. If you select data from an industry that doesn’t overlap with your own, you could skew your data and seem much worse or better than you actually are.
Note: Data in this section is taken from this report by FirstPageSage. It contains a detailed breakdown of conversion rates across industries and is a great place to get started with your benchmarking journey.
How to use funnel conversion benchmarks
Now we understand what benchmarks are and what they look like, it’s time to put them to use.
Once you’ve collected benchmarks for your industry that you can effectively compare to your internal data, you’ll have a rich pool of information to draw from. This data can become vital when developing a business strategy as it shows how you stack up against your competitors.
What’s more, you’ll see if your competitors are excelling somewhere you’re not. All this information directs you towards changes you can make to become more effective.
Here is a checklist of questions you can move through to get a better understanding of how to use conversion benchmarks:
What are you doing right?
Based on your data, are there any areas that you’re excelling in compared to your competitors? Maybe you thrive with a certain marketing medium or have a sales team that’s great at closing.
Wherever you beat the average, highlight that information and thank your employees for their hard work. You can also use this first question to find out your company’s strengths. Doubling down on those strengths and pushing more capital into winning marketing mediums will help your business grow.
What needs improvement?
No one company is perfect. If we have some strengths, that probably means we’ve got some weaknesses too. Looking at industry conversion benchmarks can reveal where we’re a little off base.
Instead of seeing this as a failure, use any area where you’re underperforming as a target. If you aren’t capturing many leads from website visitors, delve into the data. Maybe people are clicking off your homepage before engaging. If that’s the case, you could look into redesigning your B2B SaaS website according to leading principles.
Finding points for improvement and deducing actionable insights from them will help your business improve over time. After a year of actively working to improve your weak points, your company will be unrecognisable.
What opportunities have you missed?
Finally, reading through industry benchmarks can highlight missed opportunities for your business. If another company is getting a wave of traffic from social media clicks, but yours isn’t, it could be time to renew your strategy.
Carefully go through each marketing channel that you have data on to find any areas you could work on for the future. If you’re not up to scratch in any marketing channel, go back to the drawing board.
Alternatively, you can go to a competitor’s page and see how they’re managing that social media strategy. While copying isn’t a good idea – taking inspiration here and there.can point you toward success.
Wrapping Up
Benchmarks help businesses understand where they are in the wider context of their industry. From learning about how useful certain marketing mediums are for other companies, to shedding light on conversion rates at every stage, B2B SaaS benchmarks never fail to point businesses in the right direction.
But, just understanding what benchmarks are is only half the story. Using the information in this article, your company can start utilising benchmarking across critical points in your business. Over time, you’ll be able to course-correct, redefine your business strategy, and work to surpass industry benchmarks across the board.
With a data-driven approach, the only way is up.
Book a 30-min Introduction Call
Let's jump on a quick intro call We'll break down your project, and pinpoint exactly how we can help.


Our clients  Holaa! love working with us see their stories below!


